Friday, May 4, 2018

Enabling Powershell 5 LOGGING for Windows 7

Powershell is a very common 'tool' used by attackers these days. Therefore, we need to monitor the use of it or be able to log it's activities during malware analysis. I found this blog from Fireeye that showed how to turn it on for Windows 7. However, its missing a few steps. After installing the necessary updates according to the blog, I wasn't able to see the logging configurations in the GP editor. 

Here I will document the steps needed to reveal the configurations in GP editor in Windows 7..

First you will need to download the necessary administrative templates here.

After installing the templates, you will need to locate the files “PowerShellExecutionPolicy.admx”, and the “PowerShellExecutionPolicy.adml”. They are copied to “\Program Files (x86)\Microsoft Group Policy” by the installer . 

Then copy them into %systemroot%\PolicyDefinitions.

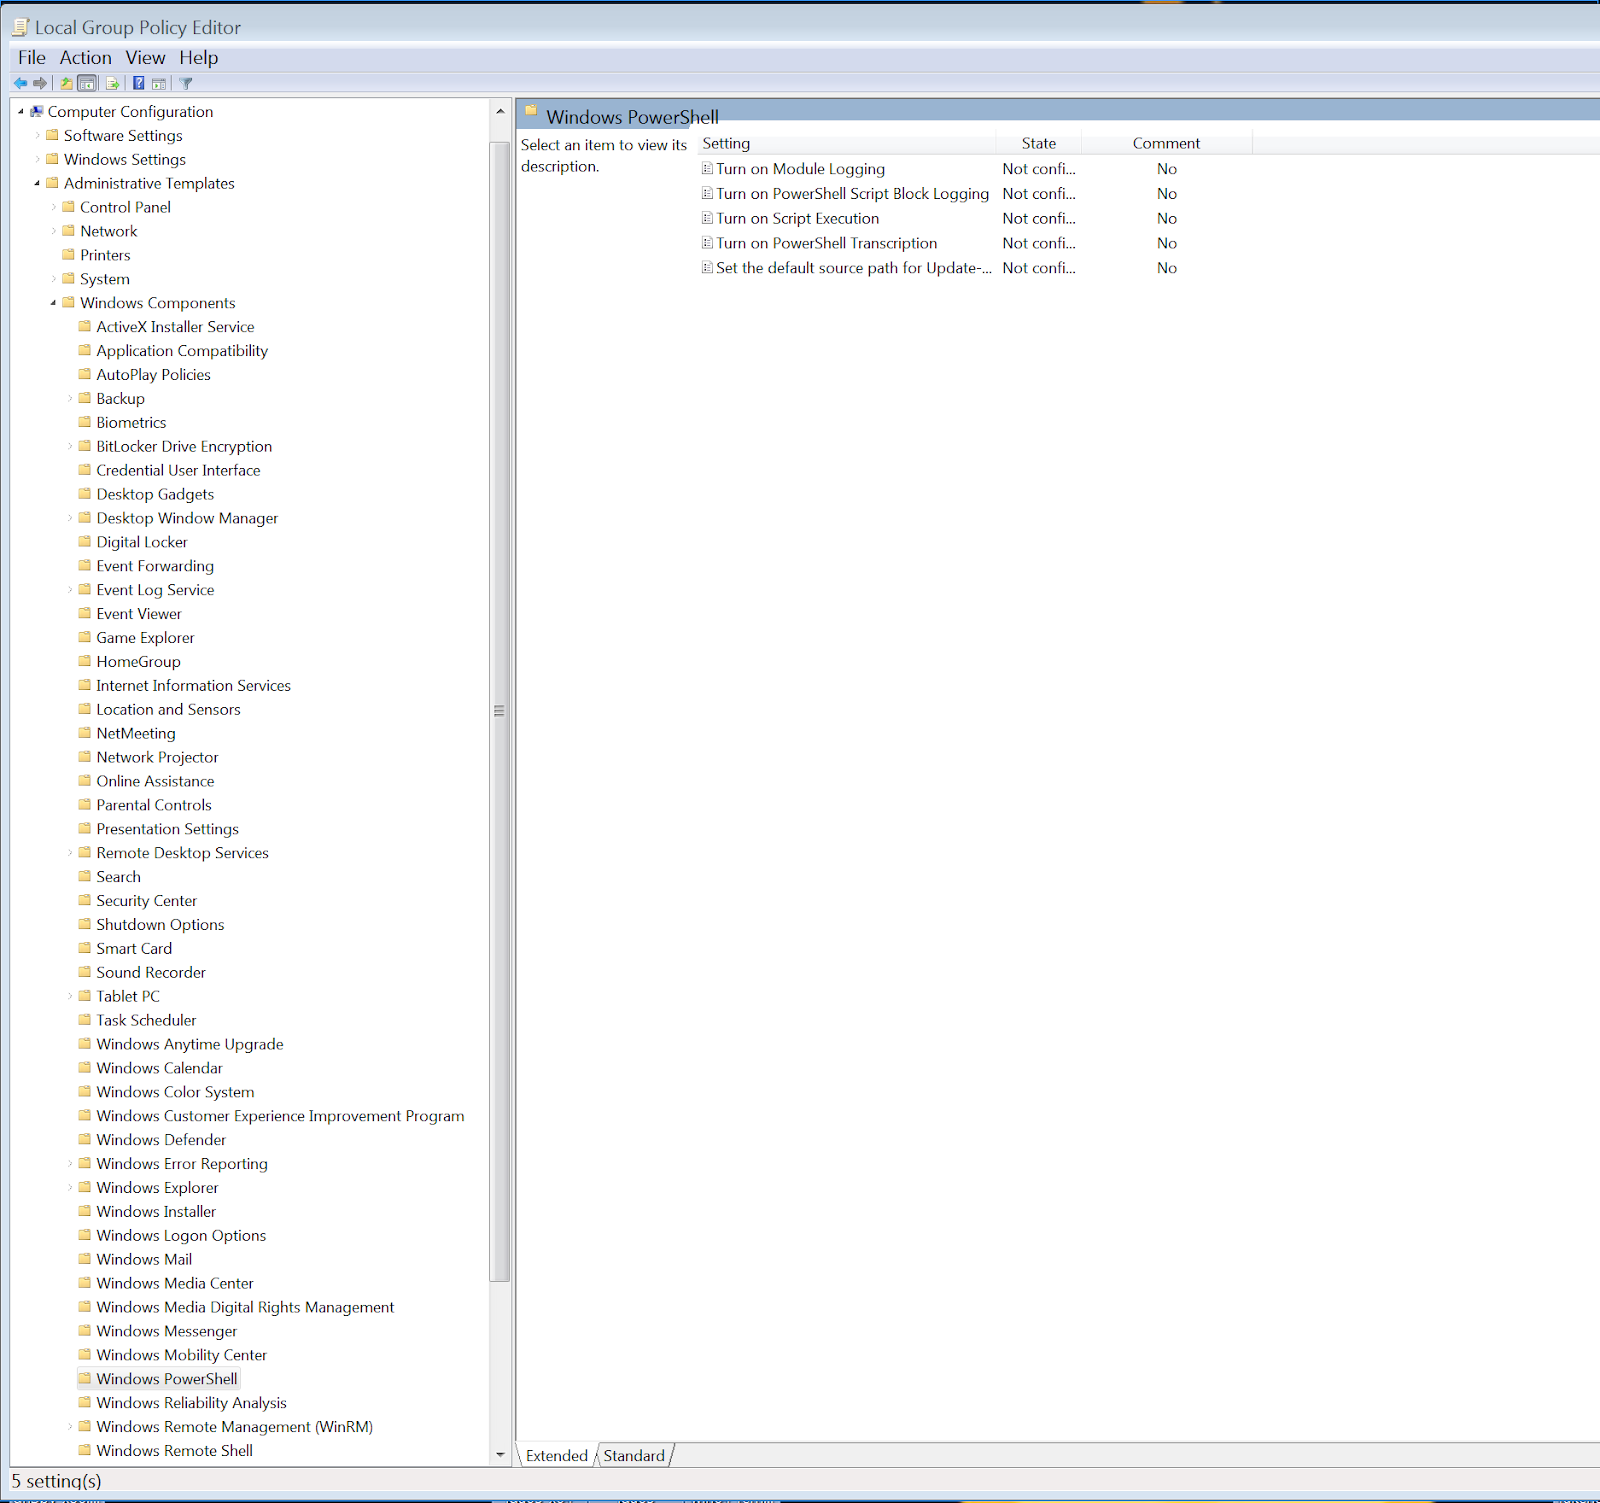
After the above steps finally, you will see this in the GP editor in Windows 7.


Just to clarify here, I found the above steps from these blogs and forums.
https://www.fireeye.com/blog/threat-research/2016/02/greater_visibilityt.html
https://www.blackhillsinfosec.com/powershell-logging-blue-team/
https://social.technet.microsoft.com/Forums/ie/en-US/2f3c75ed-97e6-4b62-9157-2f7ef6766e19/powershell-gpo-settings-not-available-download-admx-file?forum=winserverGP


Sunday, April 29, 2018

Using IDA Pro debugger and IDApython script to label indirect functions calls.

One of the ways malware authors want to hide the intend of the malware he/she is writing is by keeping the Import Address Table small or filled with useless functions. To do so an IAT would be created during the execution of the malware. There would be many indirection function calls similar to the one below. (The boxes filled with Yellow are CALL instructions.)

Without executing the malware, its hard to determine which function would be called by these indirect function calls.

After executing the malware using the IDA debugger, we can see the in-direct function calls are pointing to addresses in a list of function pointers. The address of the function pointer is stored in the ESI register. E.g. Call [esi+3c]

To speed up our analysis we could now find a means to help us label the addresses of the in-direct function calls with the function names that it is referencing.
To do so we could use the following python script:


After running the script, we could see the address of the function pointers being renamed.

We will need to create a struct from the function pointers.

Finally, we could right click and label the in-direct function calls with the function that it is going to call.


I know I have left out a few steps like how to use IDAPro debugger, create a struct and details of the functions used in the script. Just leave me a comment or question if you need more details. :)

Thanks to @nullandnull's tweet reply, I have updated my script to support the following: