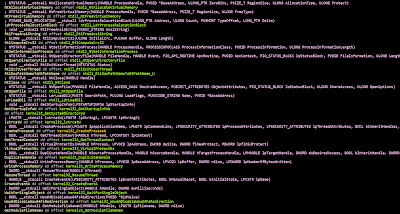
Without executing the malware, its hard to determine which function would be called by these indirect function calls.
To speed up our analysis we could now find a means to help us label the addresses of the in-direct function calls with the function names that it is referencing.
To do so we could use the following python script:
After running the script, we could see the address of the function pointers being renamed.
We will need to create a struct from the function pointers.
Finally, we could right click and label the in-direct function calls with the function that it is going to call.
I know I have left out a few steps like how to use IDAPro debugger, create a struct and details of the functions used in the script. Just leave me a comment or question if you need more details. :)
Thanks to @nullandnull's tweet reply, I have updated my script to support the following:


No comments:
Post a Comment