Friday, January 18, 2019

Windows Internals: Windows process and their handles

In this post, I will document a behavior of the Windows kernel structure, EProcess. EProcess is created whenever, a process is created in Windows. However, when a process terminate, we may assume EProcess just get cleaned up. However, this may not always be the case.

I will show what happens if a process is terminated but handles to the process is still held (or opened) by another process.

The following is a code that I will be using to explain this scenario:


The code is pretty simple. It used CreateProcessW() to launch a notepad process. Then, it calls WaitForSingleObject() to wait forever(infinite) till the notepad process is closed before the execution continues.

Using Process Explorer, we can observe a parent process that was created after the code is executed and then a child process (notepad.exe) will be created.


To demonstrate what happened to the EProcess structure of the notepad process, I will use local kernel debugging with Windbg.

First I will set a breakpoint at the following line.

1
2
  CloseHandle(pi.hProcess);//Handles must be explicitly closed if not parent process will hold on to it even if child process is terminated.
  CloseHandle(pi.hThread);


I will let the code compile and start debugging (F5 in VS2017).

A new EProcess structure for the notepad process will be created and let's see it in Windbg.


1
2
3
4
5
lkd> !process 0 0 notepad.exe
PROCESS fffffa800cdfab30
    SessionId: 1  Cid: 0e40    Peb: 7efdf000  ParentCid: 0ee4
    DirBase: 1510a000  ObjectTable: fffff8a003fd9dc0  HandleCount:  91.
    Image: notepad.exe

We can see this the only EProcess structure created for notepad.exe. At this point the code is waiting indefinitely till the notepad process is terminated (or signaled)

Using Process Explorer, we can observed 2 handles inside the process that was generated by the code. These 2 handles were generated when the child process (notepad.exe) was created.


Now let's close the notepad.exe application. The notepad process will now be terminated and the code will execute till the breakpoint is hit.

What we observed in Process Explorer:
1. The notepad process is no longer present.
2. The 2 handles to the notepad process is still present in the parent process.

However, when we go to windbg the EProcess structure for the notepad process is also still present.

Let's step over both lines of the following code in VS2017.

1
2
  CloseHandle(pi.hProcess);//Handles must be explicitly closed if not parent process will hold on to it even if child process is terminated.
  CloseHandle(pi.hThread);

The EProcess structure for the notepad process is GONE!

In summary,
The EProcess structure for a Windows process will only be removed after all the handles to the process is closed.

Please leave me any comments or questions below if you have any. :)

Additional notes:
The demo is done using Windows 7 x64, visual studio 2017 (VS2017), Windbg and Process Explorer.
Windbg is running as a local kernel debugging. (Able to only READ the kernel memory.)
Detail type information of the EProcess structure can be retrieved via this windbg command, dt nt!_EPROCESS
In Windows, processes and threads, signaled means that they are terminated.

Friday, May 4, 2018

Enabling Powershell 5 LOGGING for Windows 7

Powershell is a very common 'tool' used by attackers these days. Therefore, we need to monitor the use of it or be able to log it's activities during malware analysis. I found this blog from Fireeye that showed how to turn it on for Windows 7. However, its missing a few steps. After installing the necessary updates according to the blog, I wasn't able to see the logging configurations in the GP editor. 

Here I will document the steps needed to reveal the configurations in GP editor in Windows 7..

First you will need to download the necessary administrative templates here.

After installing the templates, you will need to locate the files “PowerShellExecutionPolicy.admx”, and the “PowerShellExecutionPolicy.adml”. They are copied to “\Program Files (x86)\Microsoft Group Policy” by the installer . 

Then copy them into %systemroot%\PolicyDefinitions.

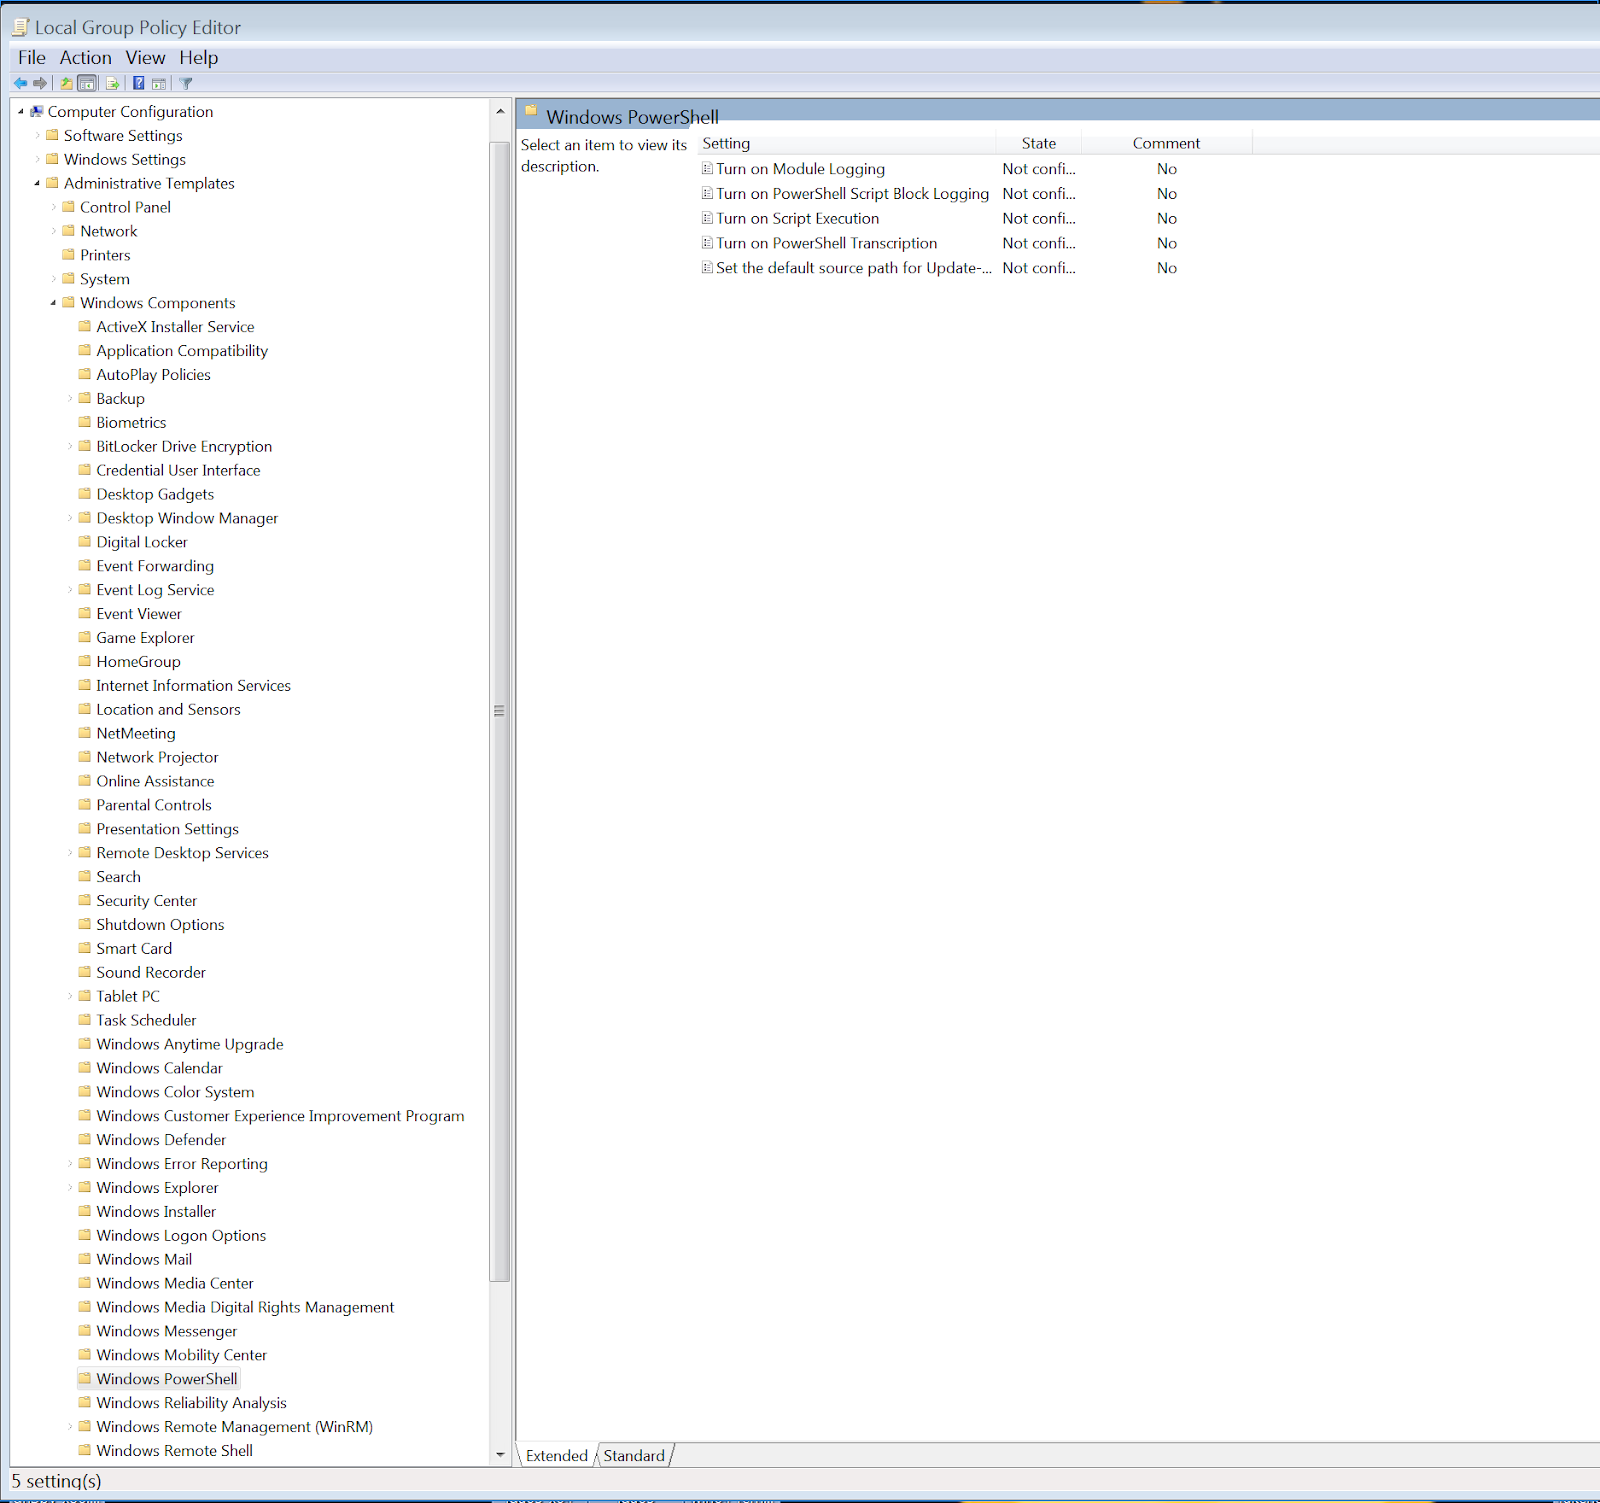
After the above steps finally, you will see this in the GP editor in Windows 7.


Just to clarify here, I found the above steps from these blogs and forums.
https://www.fireeye.com/blog/threat-research/2016/02/greater_visibilityt.html
https://www.blackhillsinfosec.com/powershell-logging-blue-team/
https://social.technet.microsoft.com/Forums/ie/en-US/2f3c75ed-97e6-4b62-9157-2f7ef6766e19/powershell-gpo-settings-not-available-download-admx-file?forum=winserverGP


Sunday, April 29, 2018

Using IDA Pro debugger and IDApython script to label indirect functions calls.

One of the ways malware authors want to hide the intend of the malware he/she is writing is by keeping the Import Address Table small or filled with useless functions. To do so an IAT would be created during the execution of the malware. There would be many indirection function calls similar to the one below. (The boxes filled with Yellow are CALL instructions.)

Without executing the malware, its hard to determine which function would be called by these indirect function calls.

After executing the malware using the IDA debugger, we can see the in-direct function calls are pointing to addresses in a list of function pointers. The address of the function pointer is stored in the ESI register. E.g. Call [esi+3c]

To speed up our analysis we could now find a means to help us label the addresses of the in-direct function calls with the function names that it is referencing.
To do so we could use the following python script:


After running the script, we could see the address of the function pointers being renamed.

We will need to create a struct from the function pointers.

Finally, we could right click and label the in-direct function calls with the function that it is going to call.


I know I have left out a few steps like how to use IDAPro debugger, create a struct and details of the functions used in the script. Just leave me a comment or question if you need more details. :)

Thanks to @nullandnull's tweet reply, I have updated my script to support the following:


Thursday, February 23, 2017

Analysis of Rovnix Dropper 5/5 - Driver and Bootkit Installation

In the final post on the my analysis of the Rovnix dropper, I will document how the sample install drivers and bootkits.

After achieving HIGH integrity as documented in the previous post, the sample will first terminate its parent process which is likely to be the sysprep.exe process.

Next, the sample check for the use of volume encryption application such as Bitlocker and Truecrypt.

Then the sample checks if it has sufficient privileges (SeLoadDriverPrivilege and SeShutdownPrevilege)

With sufficient previleges, the sample will now load and install the driver as a service. The service name is created with the string "BS" concat with the volume ID of the HDD of the victim machine.

After installing the NotMyFault driver, the bootkit will be injected next.

A x64 driver payload would be decrypted first.
Next, the modified Initial Program Loader (IPL) in the Volume Boot Record (VBR) would be decrypted
Then both these payloads would be injected into the HDD sectors

The driver payload would be written into sector 0x1600 (5632)

The IPL of the VBR is overwritten.

The driver payload and the IPL modification is now completed! The Rovnix dropped will cause a BSOD via the NotMyFault driver.

This concludes the long over due blog posts on my analysis of the Rovix dropper. I hope to document how the dynamic analysis from the execution of the modified IPL to the loading of the driver payload.


Analysis of Rovnix Dropper 4/5- Bypassing UAC

In the first post, I mentioned that the sample always caused a BSOD after execution. The BSOD was due the execution of the Sysinternals tool, NotMyFault. In this post, I will cover how NotMyFault was installed and executed by the sample.

The sample works for both x86 and x64 Windows environments. In x64 Windows, drivers had to be signed before they could be loaded and executed. NotMyFault was actually signed a driver that was signed by Sysinternals. This driver was considered legit and would be loaded by Windows x64.

However, the sample could not load drivers directly as it had only MEDIUM integrity. The User Access Control (UAC) would prompt users to ask for permission to load and install the driver. To bypass UAC the sample executed the following 4 steps.

  1. Write a modified cryptbase.dll into the temp directory.
  2. Pack the modified cryptbase.dll into cryptbase.msu using makecab.exe
  3. Extract cryptbase.msu into C:\Windows\system32\sysprep using wusa.exe
  4. Execute C:\Windows\systems32\sysprep\sysprep.exe using command promp
As a result of the UAC bypass technique, the modified cryptbase.dll was used to execute the sample again with HIGH integrity to load and install the NotMyFault driver.

Details on the UAC bypass technique could be found in this blog post by Parvez Anwar.

Next, I would document how cryptbase.dll was modified and then trace the modified code to execute the sample with HIGH integrity.

The sample would have to decode a blob of codes required to overwrite into cryptbase.dll

A loop to locate the .rsrc section in the cryptbase.dll was executed.

The strings and function addresses required were also written into cryptbase.dll.
The Address of Entry Point (AOE) was also updated to point to the start of the .rsrc section.

Finally the checksum was also calculated and updated into the PE header of cryptbase.dll

The following is the PE header of the original cryptbase.dll note its AOE.

Next is the modified cryptbase.dll with a different AOE.

After looking at how cryptbase.dll was modified. Let us trace how the modified cryptbase.dll was used to load and install the NotMyFault driver. Do note that the cryptbase.dll was loaded by sysprep.exe. I used the x64dbg debugger to debug sysprep.exe in Windows x64.

Inside the DLL entry point of cryptbase.dll is a loop to locate the virtual address of the .rsrc section.

Next a indirect call was made to the CreateThread function to start a new thread.

Finally, inside the new thread the CreateProcess function was called. The function created a new process using the sample path and an argument of "2"

Now the sample runs at HIGH integrity and it is ready to do some really nasty stuff!

In the next and final post of the series on analysing Rovnix dropper. I will copy how the NotMyFault driver was load and executed. I will also document how the Bootkit is inserted.

Analysis of Rovnix Dropper 3/5 - Anti Analysis (Static & Dynamic)

In the previous post, I described how I unpacked the sample. In this post, I will focused on the anti analysis techniques used by the sample. I will first touch on the anti static analysis then the anti dynamic analysis.

After the sample was unpacked, I noticed a number of strings were still obfuscated.

The strings were de-obfuscated into strings containing names of various security products during runtime:

I did not found other anti static analysis techniques such as anti-disassembly. However, I notice quite a few anti dynamic analysis techniques.

First, was a common anti VM technique to detect the use of VMware. The sample sent the VMware magic value of "VMXh" into the "VX" port using the 'IN' instruction. By reading and comparing the reply from the port the sample could detect the use of VMware.

Next, was a less common anti VM technique to detect the use of VirtualBox. The less common "VPCEXT" instruction was executed to detect the use of VirtualBox.

Then to detect the use of debuggers the "BeingDebugged" flag is checked in the PE.

Next to check for the use of various tools for instrumentation. The name of the parent process of the sample is compared against a fix list of strings.

The sample also created multiple threads to carried out its activities. The use of multi threading brought a little hurdle to overcome when debugging the sample.

All in all the sample did not make use of many anti analysis techniques. In the next post, I will cover how the sample escalated its privilege to install a driver in x64 Windows.

Sunday, February 12, 2017

Analysis of Rovnix Dropper 2/5 - Unpacking

In the previous post, I documented how I begin with the analysis of the Rovnix dropper and I concluded with the guess that I am dealing with a packed binary. In this post I showed how I unpacked the sample.

I begin by setting a breakpoint at 0x402038 which was contained a dynamic call.
From Ollydbg, I observed the address 0x3AEE590 is located in the heap and the access rights was set to RWX. At this point, the sample is unpacked yeah \o/.

After I dumped out the 'unpacked' heap memory segment and fixed the IAT. I import the 'unpacked' memory segment into IDA Pro. I noticed no strings pointing the URL that I obtained from FakeNet and no APIs were imported for accessing the internet. I guessed the sample is not unpack completely. :(

I tried to let the execution of the sample continue hoping to see the RWE memory segments created by the unpacker codes but I end up with BSOD.
I tried to hook the VirtualAlloc and HeapAlloc APIs to catch the sample dumping the unpacked binary.

Both options failed :( I guess I can only TRY HARDER!

At this point I knew, there was no short cut. I try to figure out what are the code in the heap memory segment doing. Then I noticed this:
Both the .text and .rdata sections of the binary(SUPERRAM) were set to RWE. The original memory access to these two sections were R_E not RWE. Now I understand how my hook attempts failed. The unpack was making using of SELF Modifying code. Next I set a hook at VirtualProtect and run the binary again. I noticed how the .text and rdata sections were changed from R_E to RWE.

Now, I went back to IDA Pro to look at the CFG of the heap memory segments there was no import function of VirtualProtect. WHY ? This was due to a 'trick' used by the author of the binary. It used an indirect call access to VirtualProtect API via a function table that was pre-populated with function addresses.

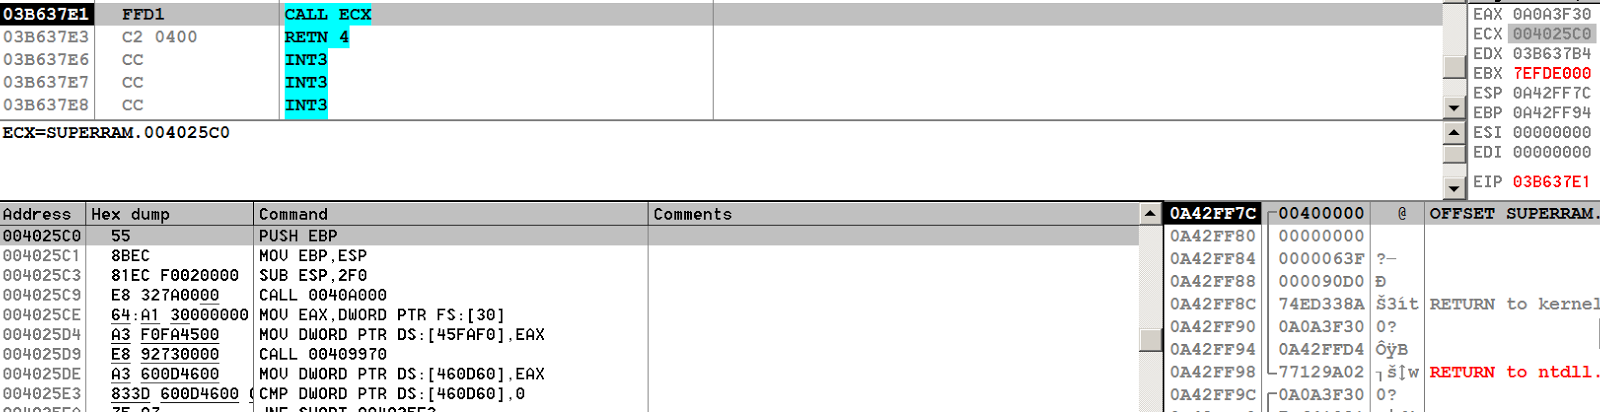
Finally, I located an indirect call that goes to the unpacked code!


Finally after fixing the IATs and executing a few functions to decode the strings, I could now dump the unpacked binary. I can now see the URL being accessed and the APIs used to access Internet.

YES finally the binary is unpacked! \o/

Next, I will cover some of the anti analysis techniques used by the sample.